 Professor Quant Partnership
Individual professor outcomes
Choose the path.
Choose the path.
See what one professor could experience.
A professor-led setup explains each choice, then shows the simulated outcomes for an individual professor on the selected path: the distribution of five-year research funding and, among professors who reach the applicable minimum, how long it takes.
Research path setup
1 / 3
- 01Team
- 02Mandate
- 03Review
What should the team try to contribute?
Ready to see this research path’s outcomes?
Research team
—
—
Research mandate
—
—
What every team contributes
- One shared codebase and evidence record
- Documented failures that remain useful to later teams
- Shared credit for the team’s accepted contribution
What could one professor experience on this path?
Each observation follows one professor in the selected mandate and team-size band.
Typical five-year research funding per professor
—
—
- Selected cohort
- —
- Modeled lifetime minimum per professor
- —
- How the minimum is funded
- Professors participate in the fund’s performance allocation because they help develop or improve its trading systems. Direct strategy attribution and the shared safety pool are designed to deliver at least this amount over time as unconstrained funding for the individual professor’s research lab.
Distribution of total direct and safety-net funding received by individual professors.
n = —Distribution among individual professors who reached the minimum.
n = —All amounts represent one professor’s funding—not the team’s combined total.
Aggregate research-funding distributions are simulated model outputs—not historical results, forecasts, or investment advice.
Management company economics
An AI-native asset-management company built to scale with fund AUM.
VC investors fund the management company—not the trading fund. Their capital supports the permanent infrastructure needed to turn rotating professor research into live strategies: data, engineering, compliance, execution, fundraising, and operations.
Recurring revenue model
2% annual management fee
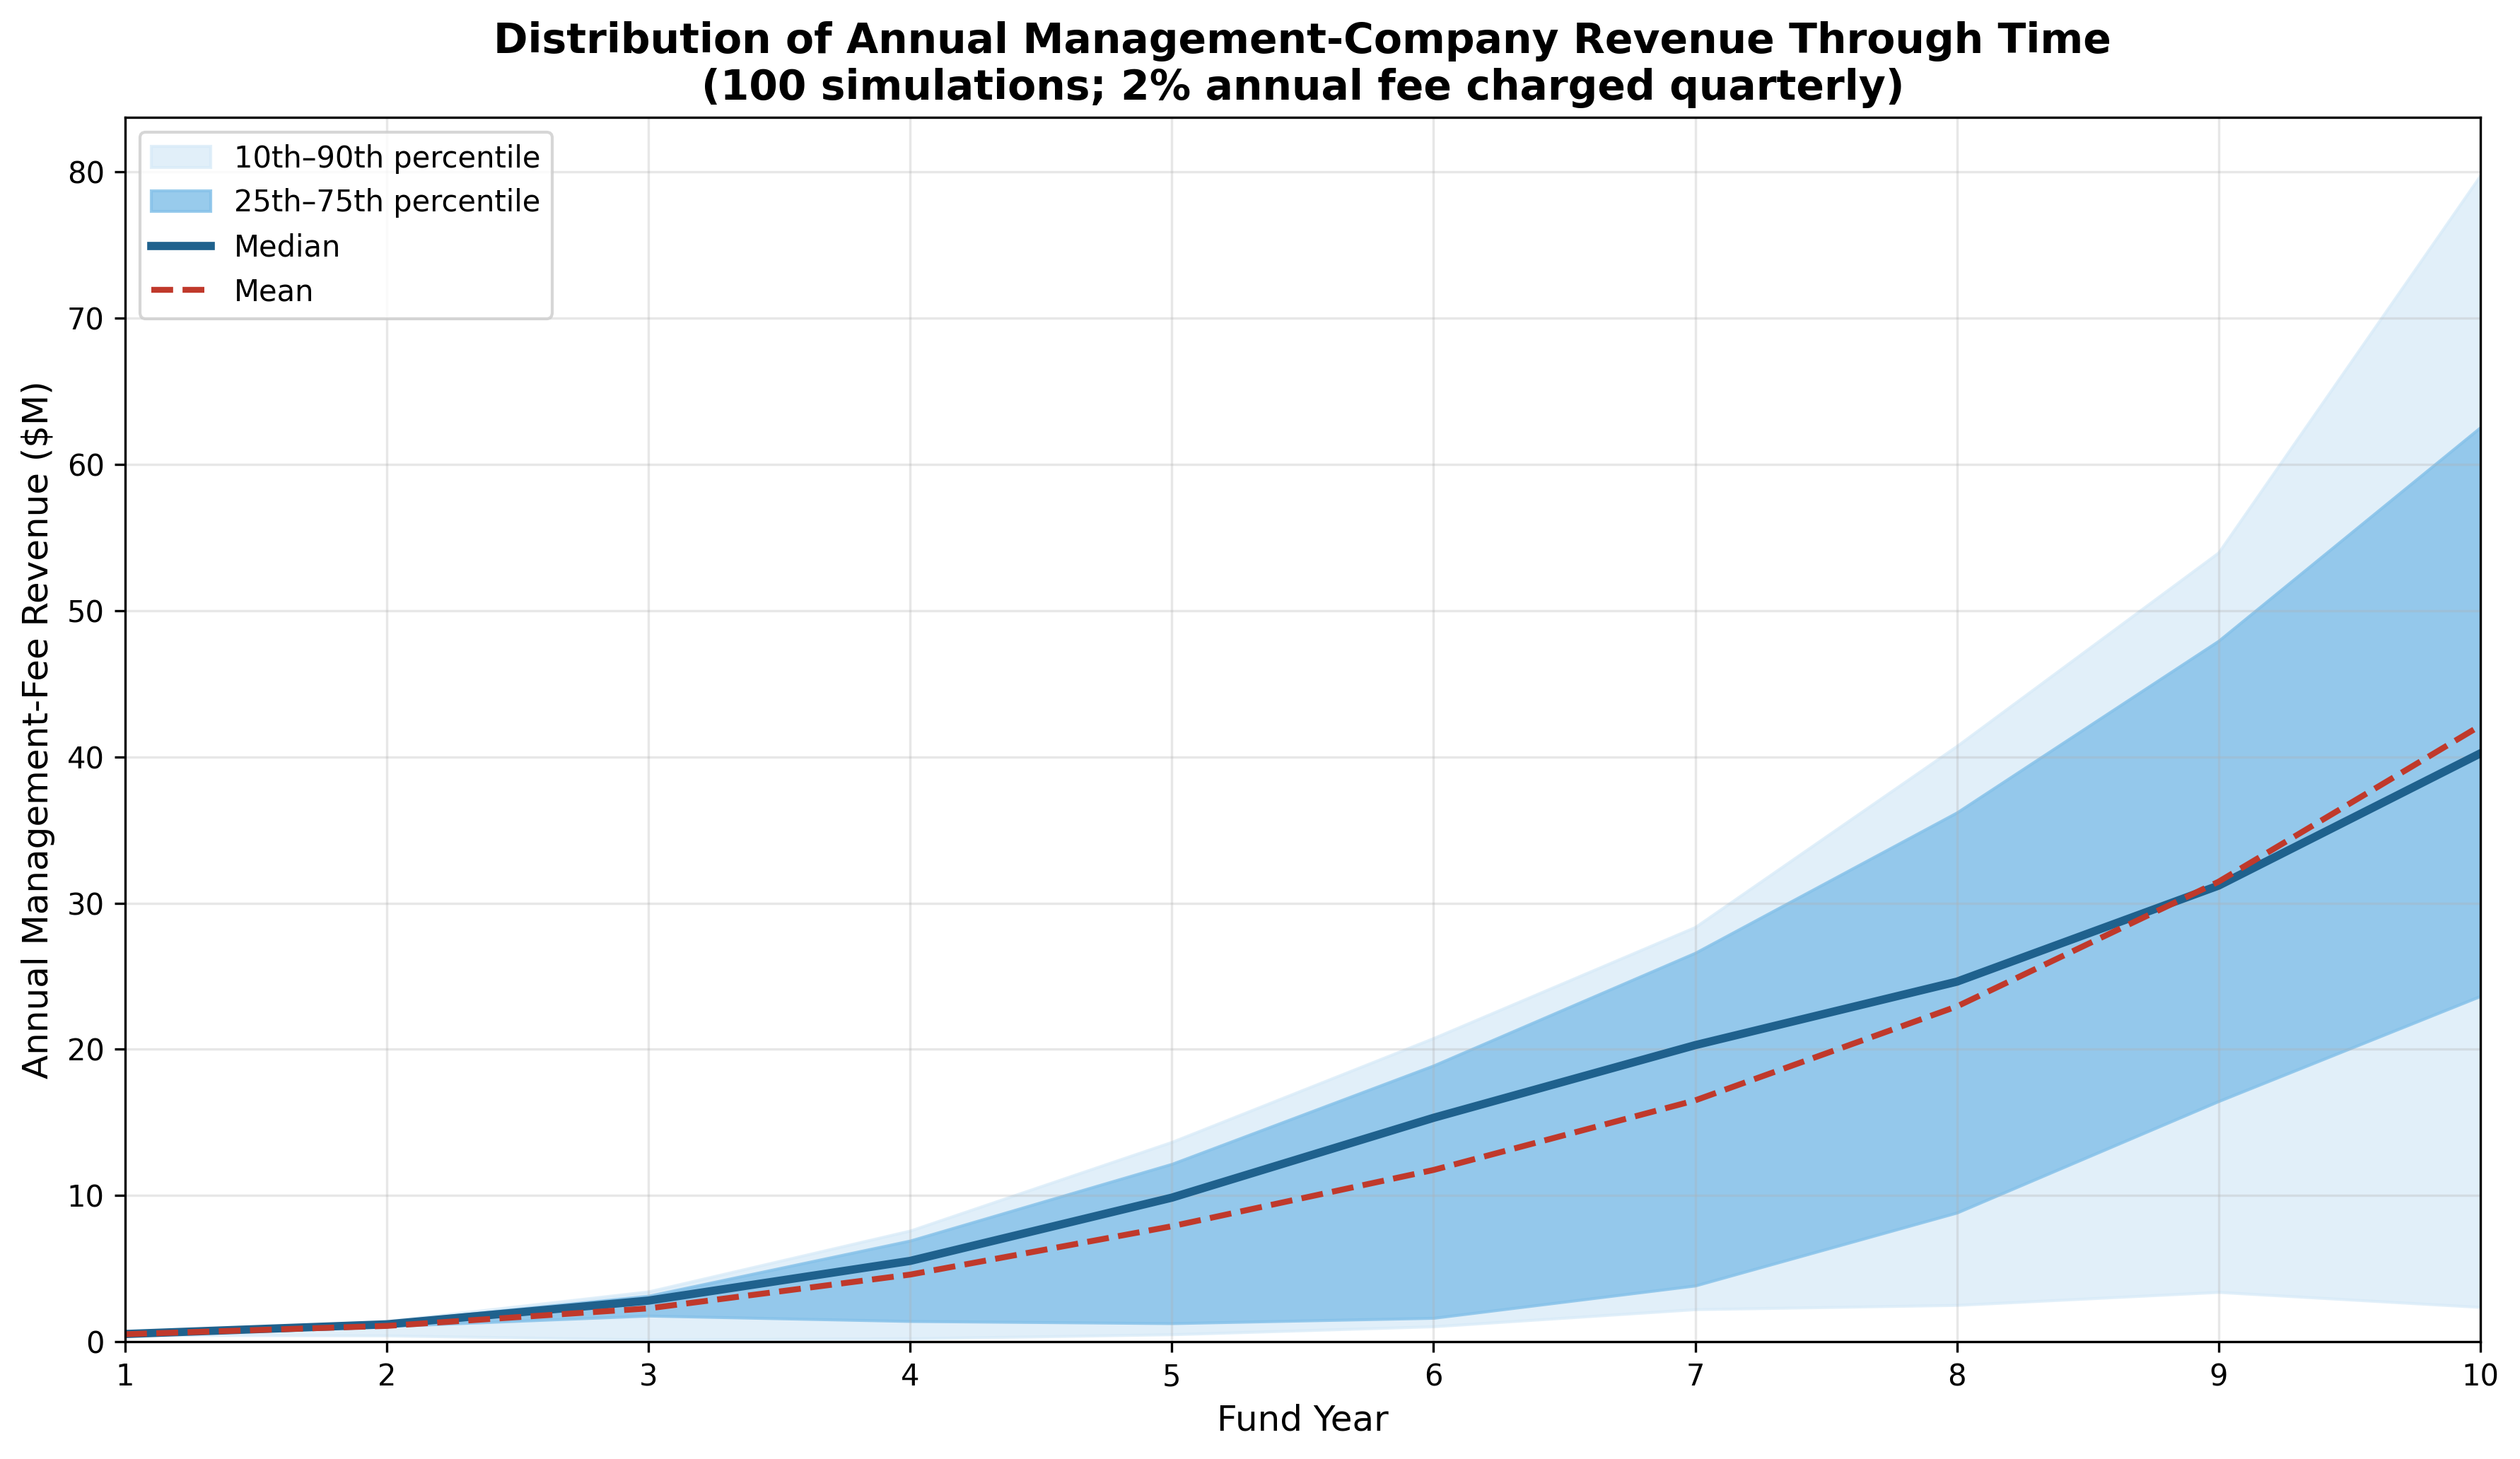
The fee is charged quarterly on fund AUM and is gross revenue for the management company. As the fund compounds and attracts capital, the same operating platform supports a larger recurring revenue base.
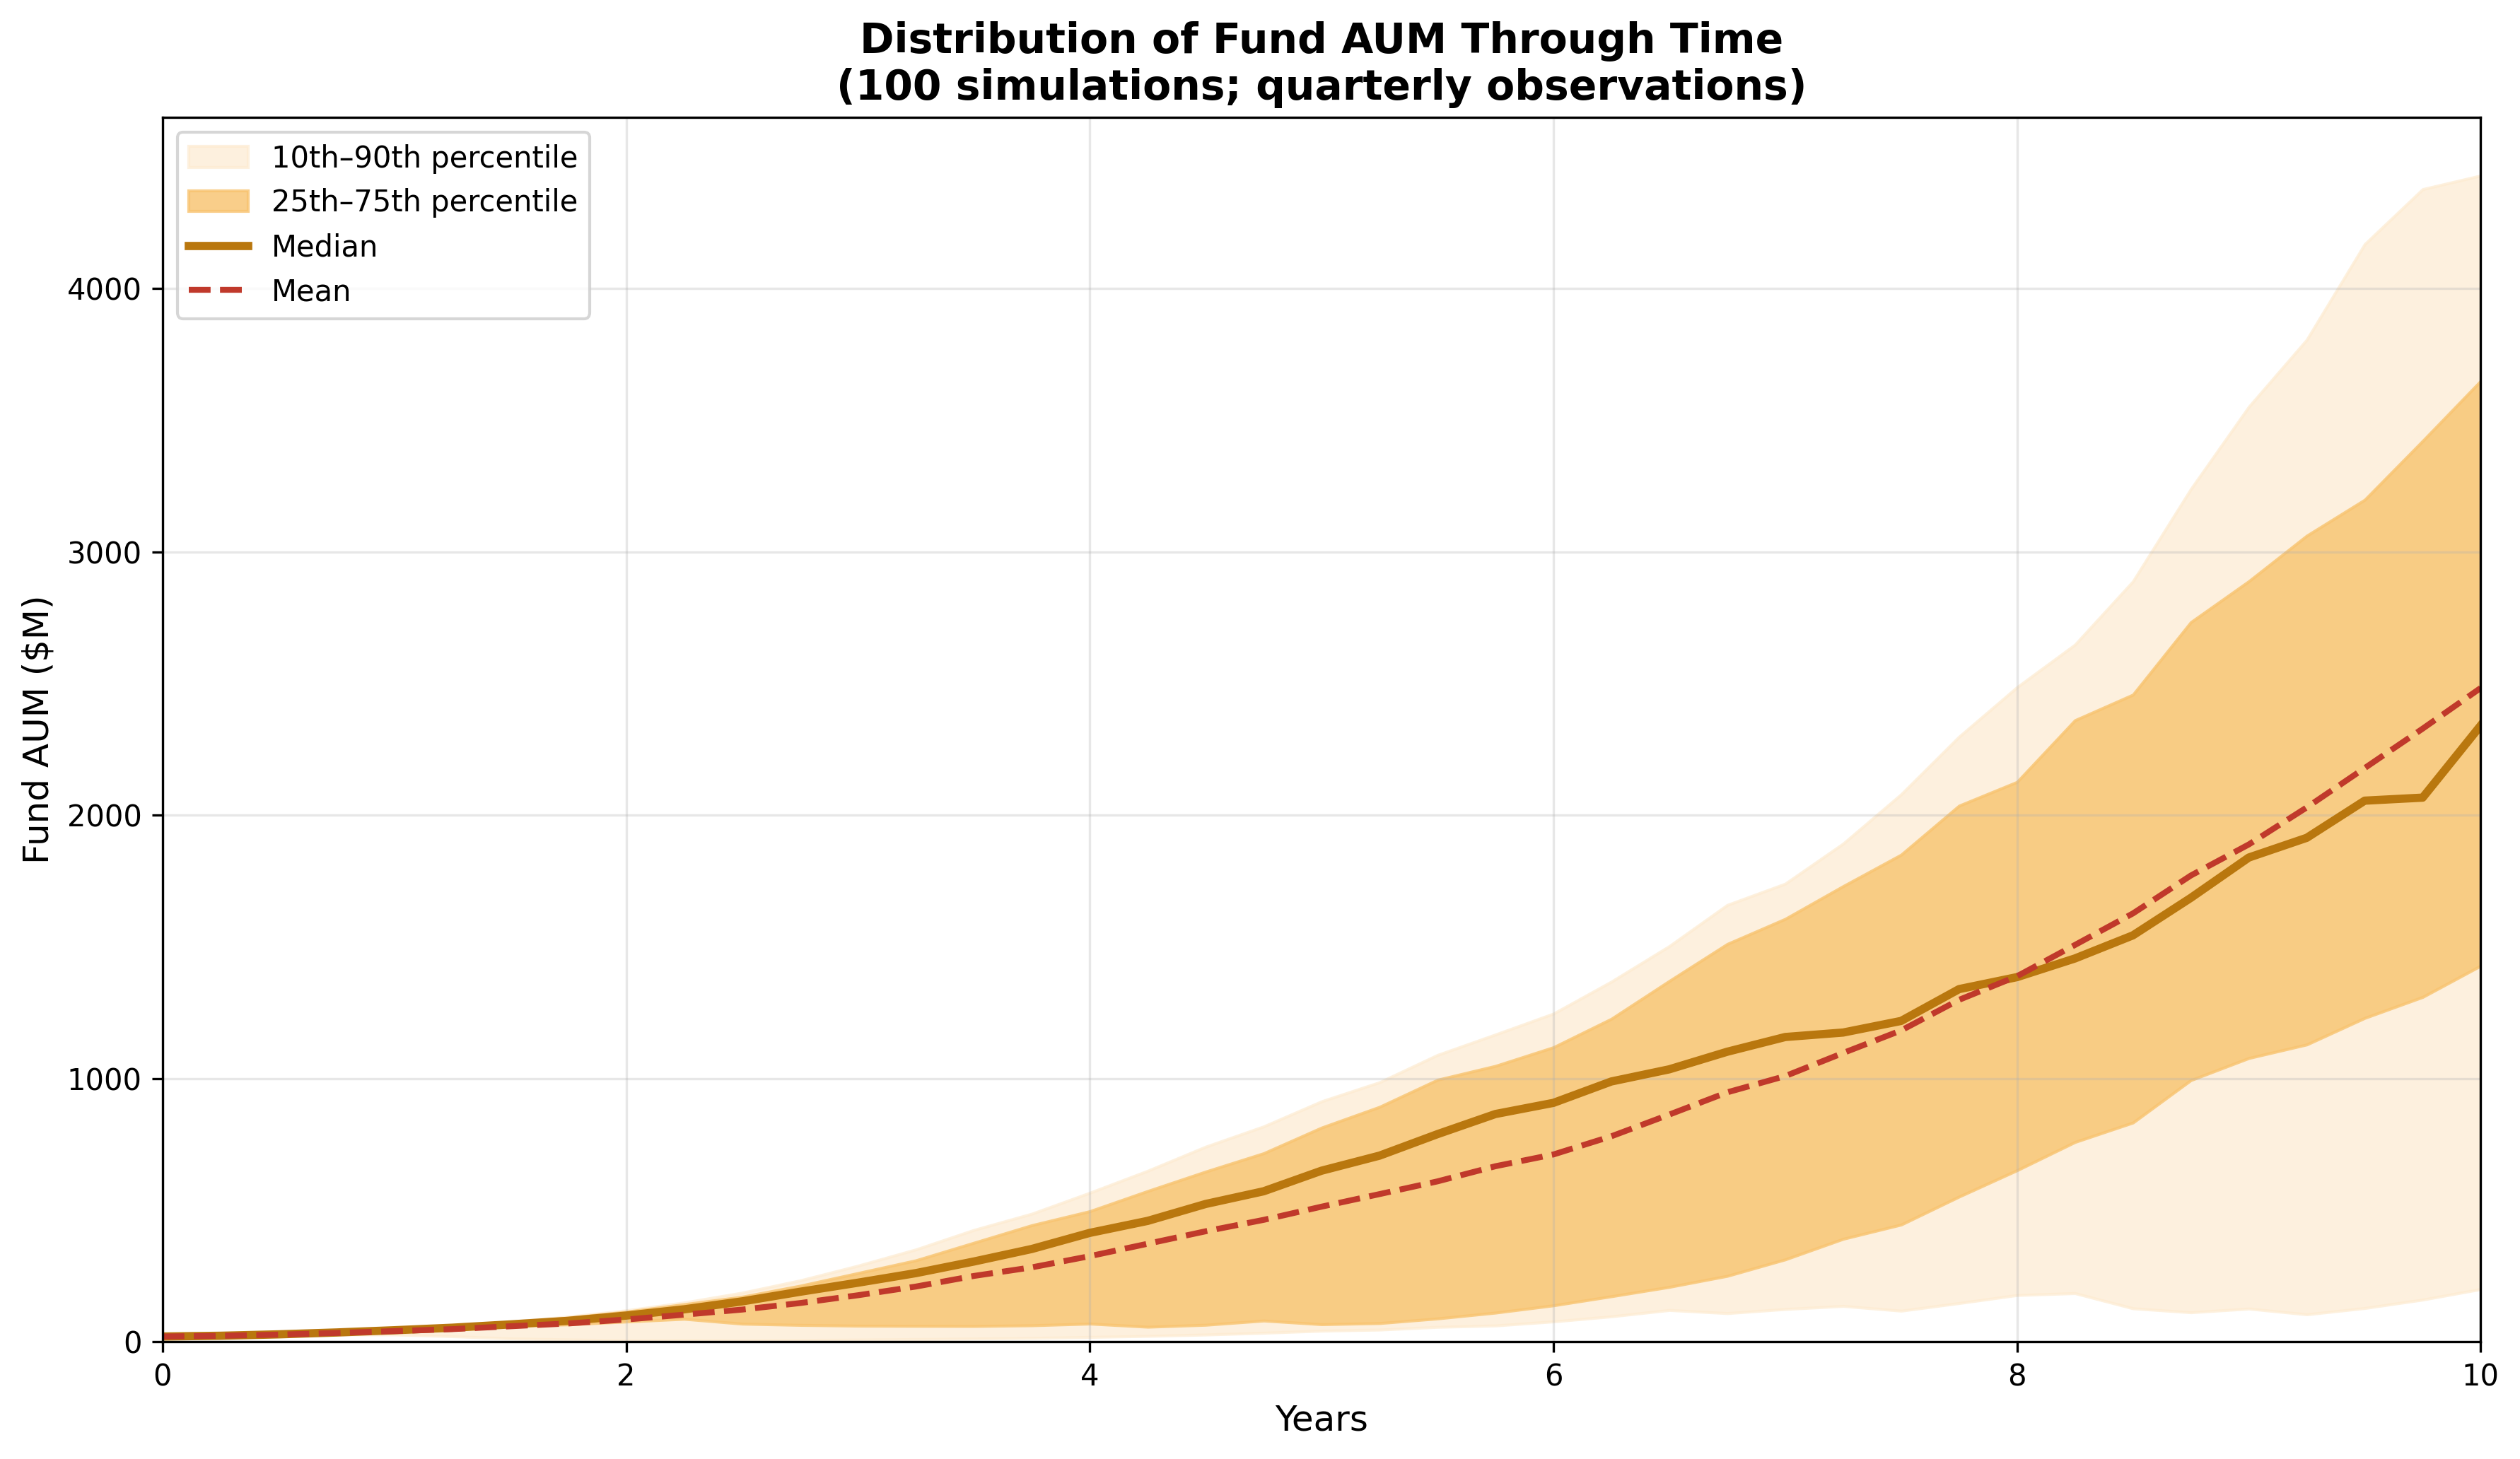
The modeled asset base producing recurring management-fee revenue.
Gross management-company revenue from the 2% annual fee.
Management fees collected across the full modeled decade.
Median, mean, and distribution bands across 100 simulated paths.
The 2% annual fee converted into gross revenue through time.
Why this can exist now
Permanent infrastructure. Rotating expertise. Compounding institutional memory.
Traditional quantitative firms scale research by continuously expanding permanent internal teams. This model combines rotating world-class professors, one shared institutional research archive, and agentic coding that compresses the path from hypothesis to production-quality implementation. The management company owns and operates the permanent platform—data, research infrastructure, deployment, compliance, execution, and institutional relationships—while each professor cohort builds on everything learned before it.
Limited partner outcomes
What one dollar invested in the fund could experience.
Limited partners invest in the trading fund—not the management company. Their capital is allocated across validated quantitative strategies and receives the fund’s investment returns after the 2% management fee and 20% performance allocation. Current fund information is available on the Vector Grove Fund website.
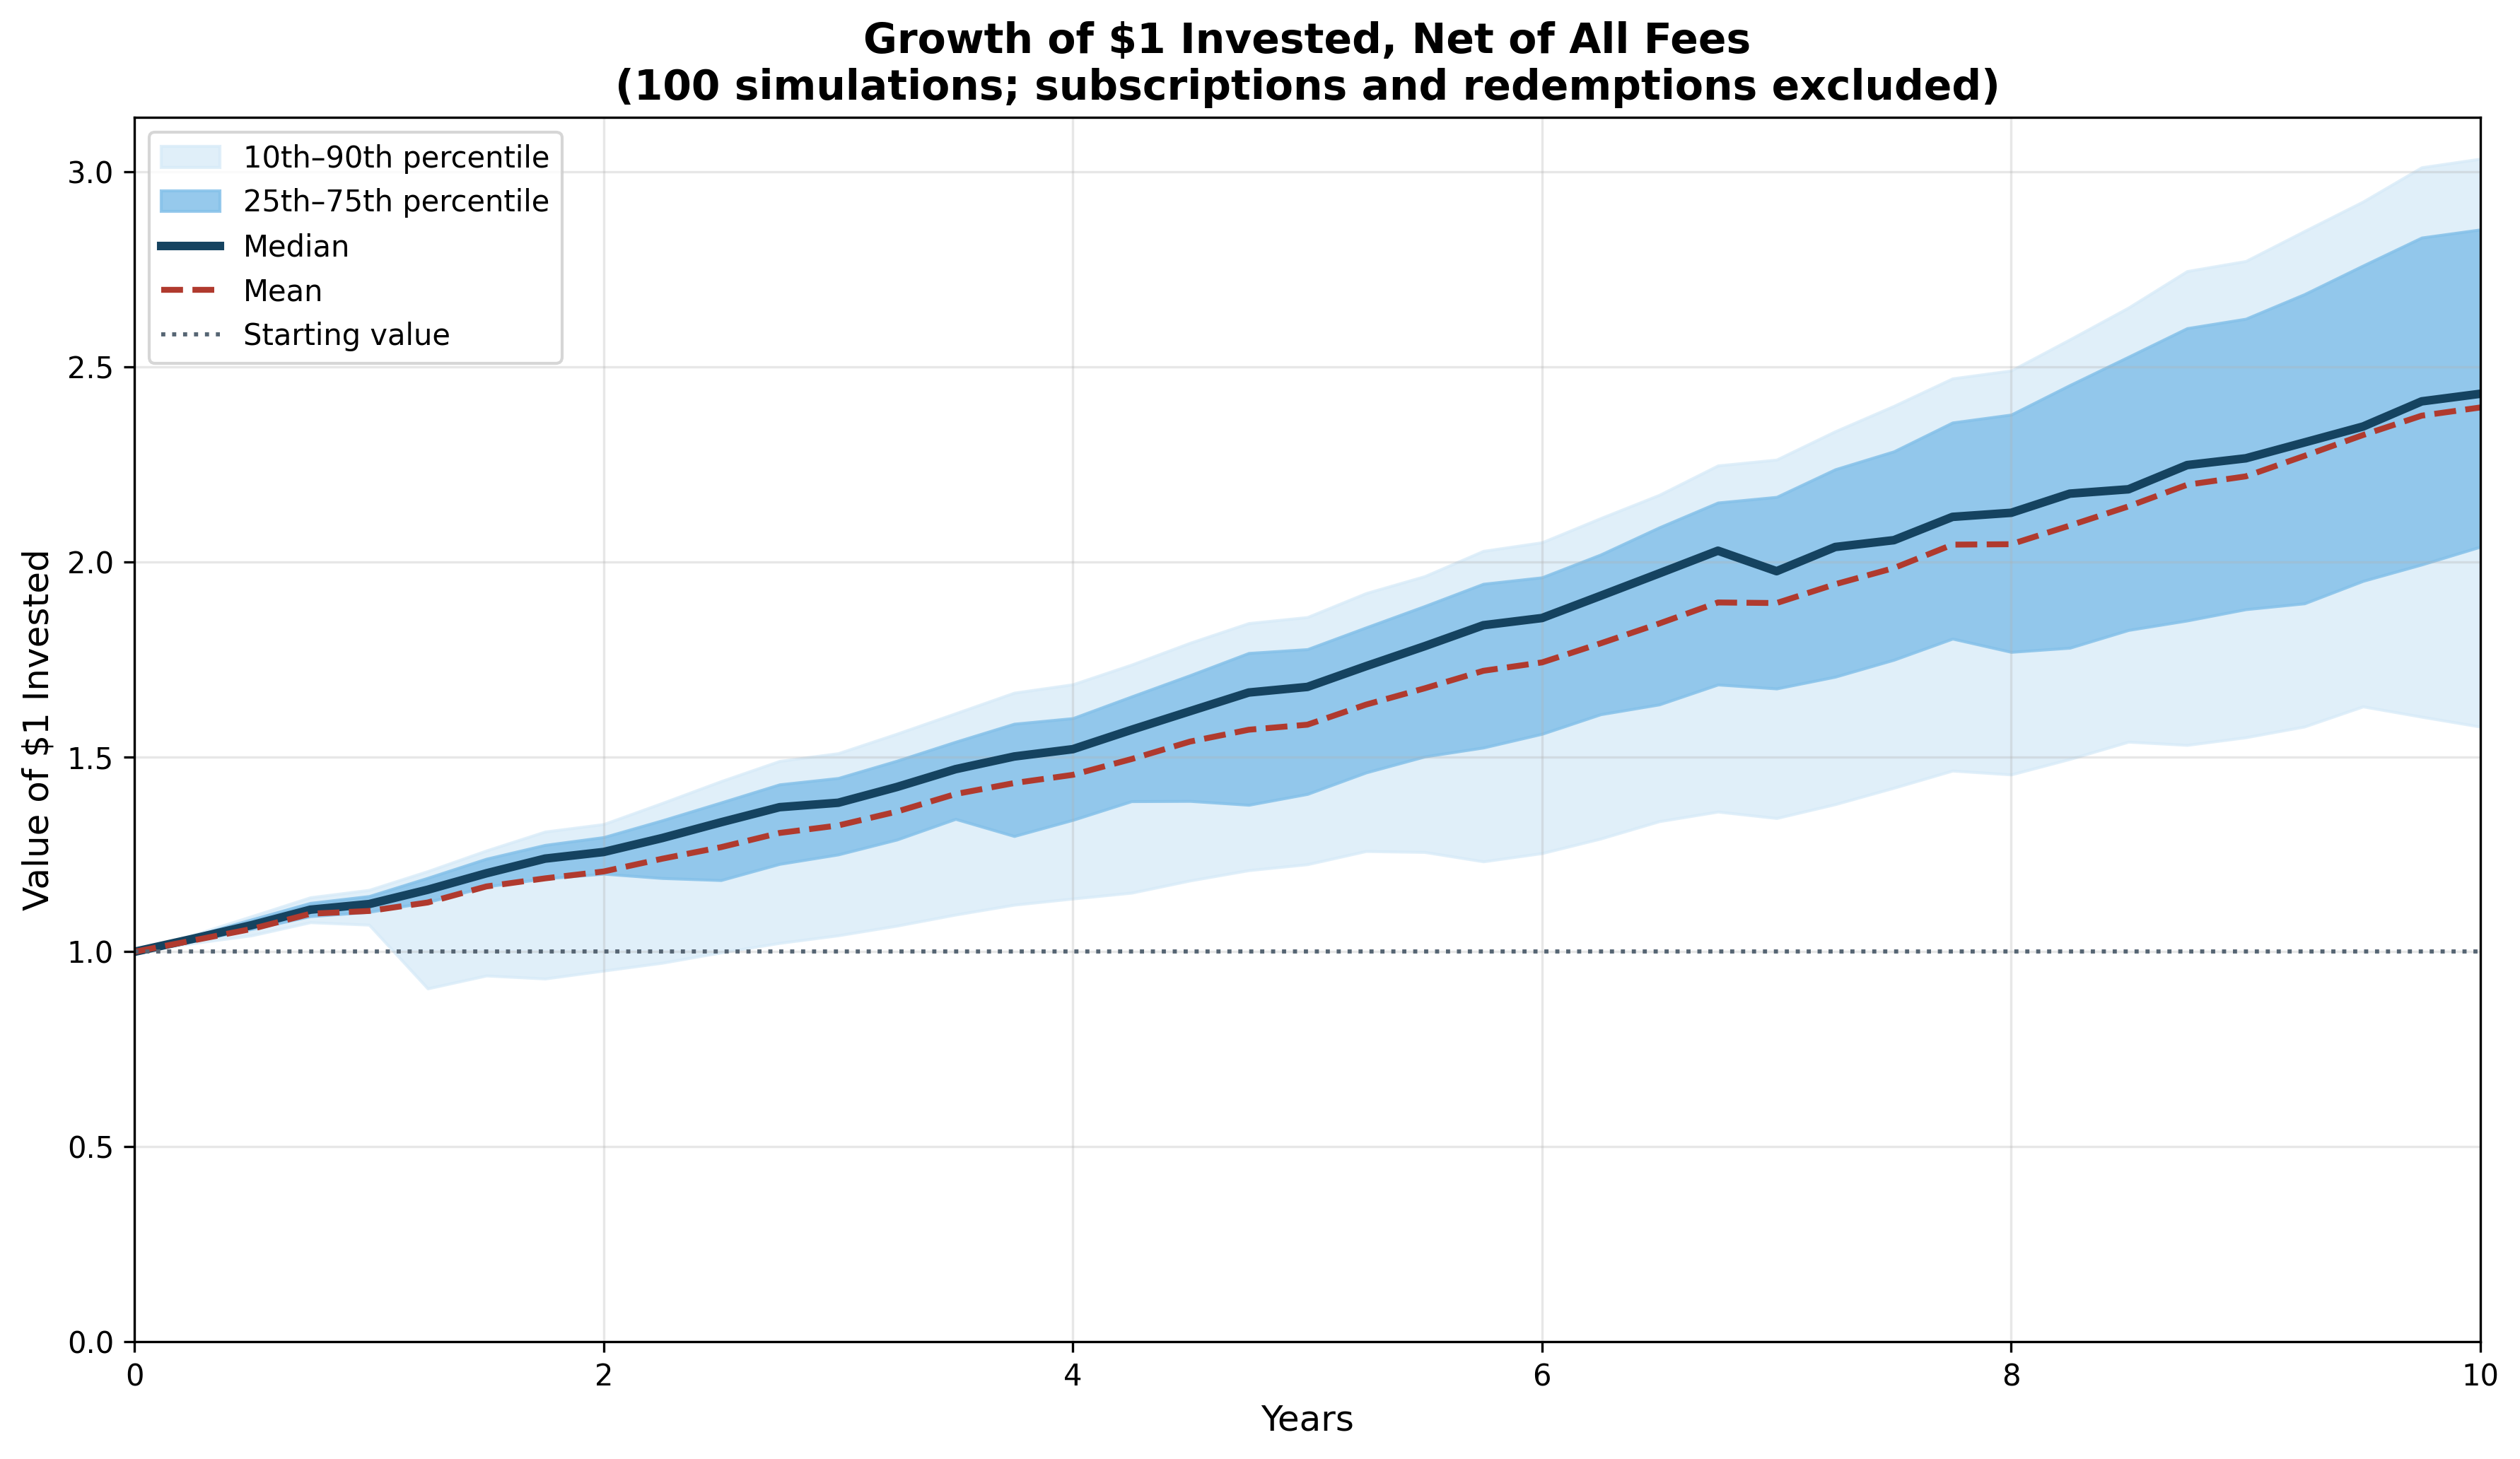
10th–90th percentile: $1.6–$3.0 after ten modeled years.
10th–90th percentile: 4.7%–11.7%, after all modeled fees.
Across 100 ten-year paths
100%
finished above the original invested value after all modeled fees.
Investment discipline
Validated research becomes a diversified, continuously improving portfolio.
Every new strategy or enhancement must pass independent validation before receiving capital. Capital starts small, scales only as live evidence strengthens, and remains under permanent oversight across portfolio construction, execution, and risk.
- 01Validate before allocating.
- 02Scale capital with evidence.
- 03Diversify across distinct strategies.
Median, mean, and distribution bands; subscriptions and redemptions do not inflate the result.
Partnership details
Questions and answers
These answers explain the current proposal and the simulation behind this website. Final legal, tax, employment, intellectual-property, and university-policy terms would need to be negotiated and approved for each partnership.
01 What is this?
This is a partnership model connecting university research, quantitative asset management, and an alternative source of research-lab funding.
Professors participate in focused research cycles to improve existing systematic trading strategies or develop new ones. Vector Grove provides the trading capital, existing strategy portfolio, shared research environment, data, execution systems, risk controls, and permanent operational infrastructure.
When a validated new strategy or an improvement to an existing strategy generates fund profits, the fund’s 20% performance allocation flows to the university research labs led by the professors who contributed that work, as unrestricted research funding. The 20% allocation provides two forms of unrestricted research funding: direct funding for the labs of professors whose strategies contributed to profits, and shared safety-net funding for eligible participating labs. All funding is delivered through university-approved channels.
The capital relationships remain distinct: limited partners invest in the trading fund, while venture investors invest in the management company that owns and operates the permanent platform.
02 Where do the numbers come from?
Every displayed number comes from the fund and research-funding simulation in the public Professor Quant Partnership repository. None represents historical investment performance.
The baseline follows 100 independent ten-year paths, with 40 quarterly periods per path. It models new-strategy research, existing-strategy enhancement, research-team formation, validation, capital allocation, strategy capacity, management fees, investor loss recovery, professor/lab performance allocations, fund subscriptions and redemptions, and external market shocks.
Individual professor funding distributions use 100 simulation runs. The time-to-minimum analysis uses 500 runs to create a larger sample of professor outcomes.
The website reports medians and percentile ranges to test whether the proposed path—from professor research to validated strategies, fund profits, and lab funding—is internally coherent. The results are not forecasts, guarantees, or investment advice.
03 Why now? What makes this new hedge-fund structure possible?
Until recently, implementation was a major bottleneck in quantitative research. Turning a specialist’s insight into a rigorous trading investigation required substantial time for data preparation, coding, testing, debugging, and repeated experimentation. That favored permanent teams whose researchers combined market knowledge, quantitative training, and years of software-engineering experience.
Agentic coding changes the speed and economics of that process. Professors can use coding agents to translate deep domain expertise into testable research, automate repetitive research loops, analyze unfamiliar datasets, compare modeling techniques, and iterate far more quickly. They do not need to begin as seasoned software developers or career quantitative researchers to investigate whether their ideas can improve a portfolio.
This makes a rotating-professor structure practical. Professors can contribute differentiated expertise in portfolio optimization, faster computing, automated experimentation, market structure, new modeling methods, and data analysis. Vector Grove’s permanent team continues to provide the shared codebase, data, research infrastructure, validation, risk controls, execution, compliance, and live monitoring.
Agentic coding accelerates research; it does not lower the bar for deployment. Every contribution must still survive independent validation, transaction costs, capacity limits, risk review, and controlled live testing before receiving meaningful capital.
04 What must a professor bring? Is participation limited to finance professors?
A professor does not need to arrive with a completed trading strategy.
A research cycle can begin with a mathematical insight, empirical hypothesis, modeling technique, or targeted problem such as increasing strategy capacity, reducing slippage, strengthening risk controls, testing a new signal, or improving an existing strategy.
Relevant expertise can come from statistics, optimization, machine learning, operations research, physics, engineering, simulation, computational modeling, and other quantitatively rigorous fields—not only finance.
05 How long does a professor work with the fund? Is it full-time, remote, or in-person?
The current proposal assumes a focused six-to-twelve-month research cycle. During an approved sabbatical or research leave, the role is expected to be a concentrated, potentially full-time research commitment.
Whether participation is remote, hybrid, or in-person would be defined by the partnership agreement and university policy rather than imposed as a universal requirement.
When the cycle ends, the professor returns to normal university work. Vector Grove remains responsible for production monitoring, data and broker changes, execution, risk controls, capital allocation, incidents, approved future improvements, and eventual strategy retirement.
06 Would universities view this as diverting professors from their academic mission?
That is a legitimate institutional concern. A partnership should proceed only when the university regards the work as compatible with its research, sabbatical, conflict-of-interest, and intellectual-property policies.
The proposal is not for professors to conduct personal speculative trading. It is a structured applied-research program with documented hypotheses, evidence requirements, independent review, controlled deployment, and a potential source of funding for the professor’s research lab.
Faculty participation is voluntary and separate from any endowment investment. If a university concludes that a collaboration conflicts with its academic mission, that faculty collaboration should not proceed.
07 Are there enough suitable professors, and how would Vector Grove recruit them?
This remains an important pilot question, not something the simulation proves.
The initial pilot requires only two professors. Candidates could be sourced through university partnerships, professional referrals, focused outreach, academic conferences, and an application process asking researchers to explain how their expertise could improve quantitative models.
08 How does the model scale if the pool of qualified professors is limited?
The model is designed to scale through accumulated strategies, reusable infrastructure, and institutional memory—not by increasing professor headcount in direct proportion to every experiment.
Each cohort inherits the existing codebase, successful strategies, failed investigations, data infrastructure, and prior evidence. Agentic coding further increases the amount of research a small team can test.
The model assumes that one professor would be actively contributing a strategy for every $45 million in fund assets. At the modeled median 10-year AUM of approximately $2.3 billion, this would mean about 51 professors participating at any given time.
The simulation produces a median of approximately 230 cumulatively funded professors or labs over ten years. Both figures are modeled outputs, not recruitment forecasts.
09 What must the first one or two professors prove?
The pilot should demonstrate the complete path on a small scale:
- Begin with approximately $20 million of fund capital, an existing seed strategy, and two initial professors.
- Have the professors improve an existing strategy or investigate a new one.
- Produce a documented evidence package covering robustness, costs, capacity, drawdowns, regimes, and failure modes.
- Pass an independent review gate.
- Begin with paper, shadow, or limited-capital deployment.
- Show that the contribution improves risk-adjusted returns, capacity, execution, or diversification.
- Generate eligible profits after prior investor losses are recovered.
- Pay the resulting professor/lab performance allocation into the approved institutional research account.
The first pilot should be judged on research quality, conversion to controlled deployment, net LP returns and drawdowns, operating burden, and actual lab funding—not simply on how many ideas are generated.
10 What happens when a professor’s ideas do not work?
A professor’s research funding is not an all-or-nothing bet on whether that professor personally develops a profitable strategy.
When the fund generates eligible profits, it charges the 20% professor/lab performance allocation. Up to 50% of each new allocation can provide direct funding to the research labs of professors credited with the profitable strategy or improvement. The remainder supports shared safety-net funding for eligible participating labs that have not yet reached their modeled funding minimum.
The fund follows a high-water-mark rule. If the fund incurs losses, the 20% professor/lab performance allocation pauses until those losses have been recovered for LPs. Once the fund exceeds its previous high-water mark, the 20% allocation resumes on new eligible profits.
A professor can therefore receive safety-net funding even if that professor’s research is not deployed or does not generate a direct strategy payment. The current model uses a $1.5 million lifetime funding minimum for a professor who has participated in the development of a new strategy and a $1 million minimum for other eligible contributors.
All direct and safety-net funding comes from the professor/lab performance allocation—not from LP principal or the management fee. Research that does not succeed is retained in the shared research archive so future teams can learn from it instead of repeating the same investigation.
11 Does the research funding go personally to the professor or to the university?
The proposed default recipient is a university-approved research lab or research account—not a professor’s personal trading account.
In the current simulation, the full 20% professor/lab performance allocation is charged only on eligible profits after investor loss recovery. Up to 50% of each new pool can be paid through direct strategy attribution according to recorded ownership. The remainder of the charged pool and any carried reserve support eligible contributors below their applicable modeled funding minimum.
The recipient, university share, overhead treatment, tax treatment, and permitted use of funds must be agreed with each university. The simulation does not determine those legal or policy terms, and the modeled minimums are not contractual guarantees.
12 What exactly would a VC investor own, and what creates enterprise value?
VC investors would own equity in Vector Grove Capital Management, Inc., subject to the terms of the investment. They would be investing in the management company—not becoming limited partners in the trading fund.
The management company owns and operates the permanent platform that allows rotating groups of professors to develop and improve trading strategies. This includes the research infrastructure, intellectual property, data systems, execution capabilities, risk controls, compliance operations, fundraising relationships, and accumulated institutional knowledge. VC capital would support the development and expansion of this platform.
The management company’s modeled recurring revenue comes from an annual management fee equal to 2% of fund AUM. Across the current 100 simulated 10-year paths, the median fund AUM after 10 years is approximately $2.3 billion. At that scale, the model produces approximately $40.2 million in annual gross management-fee revenue and approximately $154.7 million in cumulative gross revenue over the full 10-year period, before operating expenses.
These figures are simulated outcomes based on the model’s assumptions—not forecasts or claims about the company’s future valuation.
13 How are limited partners protected, and what downside does the model show?
Limited partners invest in Vector Grove Fund, LP, not in the management company. Their returns are calculated after the modeled 2% annual management fee and 20% performance allocation.
Investor protections in the model include prior-loss recovery before performance allocations, evidence review before deployment, limited initial capital, strategy-capacity constraints, live monitoring, and diversification across validated strategies.
Across the current 100 ten-year simulation paths, the median net annualized LP return is 9.3%, with a 10th-to-90th-percentile range of 4.7% to 11.7%. One dollar grows to $2.43 at the median, with a $1.58-to-$3.03 10th-to-90th-percentile range.
Median maximum drawdown is approximately 16.6%, and the 90th-percentile maximum drawdown is approximately 31.7%.
These are modeled outcomes under stated assumptions—not historical performance, assurances, or investment advice.
14 Must a university endowment invest before its professors can participate?
No. Capital participation and faculty research participation are deliberately separable.
The endowment makes an independent fiduciary decision about investing as an LP. Faculty members and university administrators separately decide whether research participation is academically and institutionally appropriate.
Keeping those decisions independent avoids conditioning an academic opportunity on an investment commitment. A university can participate on the research side, the investment side, both, or neither.
Start a conversation
Contact Vector Grove Capital Management.
We welcome focused conversations with professors, universities, limited partners, venture investors, and strategic partners who want to evaluate the model or help build the platform.